
Jørgen Ringen


In a recent post I took a look at how to accomplish distributed logging across different microservices by using Spring Cloud Sleuth. In this post I’ll look at how to aggregate and visualise tracing information by using Zipkin . Zipkin is a distributed tracing system. It helps gather data needed to troubleshoot latency problems in microservice architectures. It manages both the collection and lookup of this data
We’ll set up at Zipkin server by using Spring Boot. Add the following dependencies to your pom.xml
<dependency>
    <groupId>org.springframework.boot</groupId>
    <artifactId>spring-boot-starter</artifactId>
</dependency>
<dependency>
    <groupId>io.zipkin.java</groupId>
    <artifactId>zipkin-server</artifactId>
    <version>${zipkin-version}</version>
</dependency>
<dependency>
    <groupId>io.zipkin.java</groupId>
    <artifactId>zipkin-autoconfigure-ui</artifactId>
    <scope>runtime</scope>
    <version>${zipkin-version}</version>
</dependency>
Include the @EnableZipkinServer in the Spring Boot Application class:
@SpringBootApplication
@EnableZipkinServer
public class ZipkinServerApplication {

	public static void main(String[] args) {
		SpringApplication.run(ZipkinServerApplication.class, args);
	}
}
This is everything you need to get zipkin up and running. Start the application and access localhost:8080 and you’ll see an empty zipkin dashboard.
Lets modify our application from the spring boot sleuth post and enable them to send data to zipkin:
Add spring-cloud-sleuth-zipkin to the pom.xml:
<dependency>
    <groupId>org.springframework.cloud</groupId>
    <artifactId>spring-cloud-sleuth-zipkin</artifactId>
</dependency>
Add zipkin properties to application.properties:
spring.zipkin.service.name=foo-service
spring.zipkin.base-url=http://localhost:9000
spring.sleuth.sampler.percentage=1.0
We’ll set the sampler-percentage to 1.0 (100%). This means that all the log statements will be sent to zipkin. This might cause a lot of traffic in production and you should pick a number that suits your use case.
Let’s call the foo-service which in turn calls the bar-service. Here’s how it’s visualised in Zipkin:
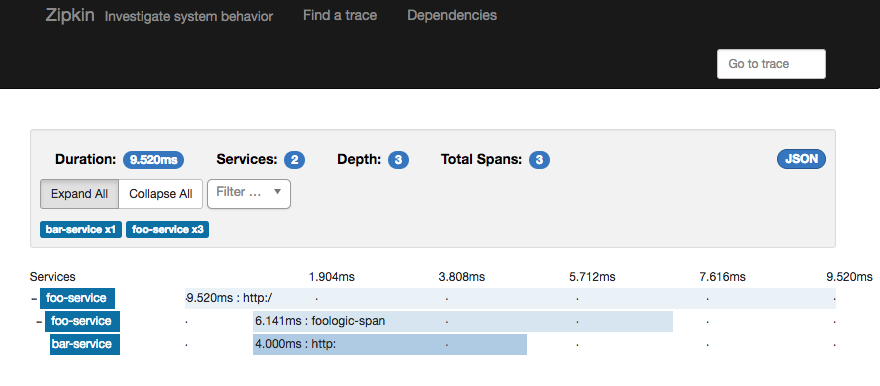
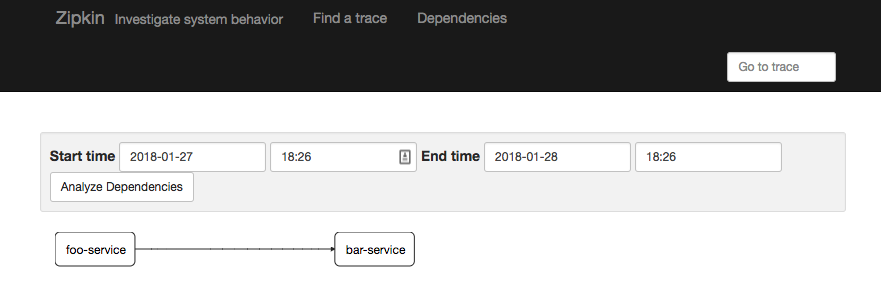
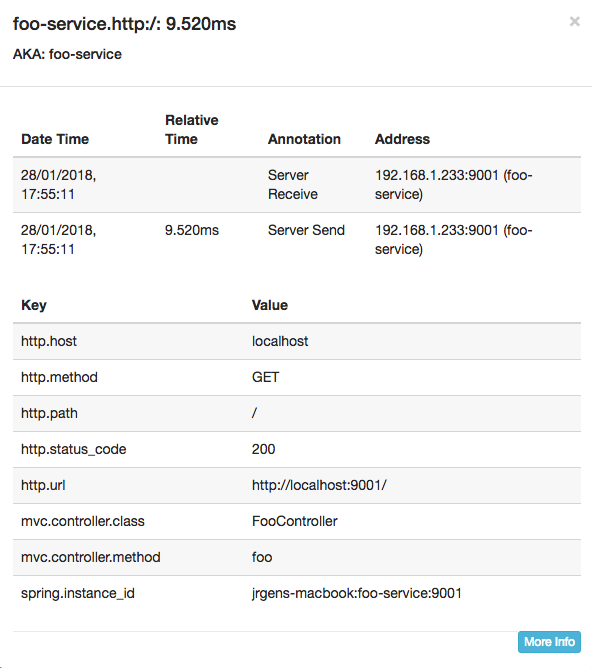
You can do a lot of customisation and zipkin provides a rest-api if you want to build your own dashboard and do custom queries. You can also configure your application and create custom logic for deciding what type of data that get’s sent to zipkin.
Example-code: https://github.com/JorgenRingen/spring-sleuth-zipkin-poc